To summarise my knowledge of info-graphics so far, it is a graphic (picture) that displays information. I found this part of the course quite fun and found that it suited my strengths well because I am a visual learner and I love it when the information is graphed into a picture.
For this task we were required to create an infographic using the easel website. I loved having various templates available to use. I found that this saved time creating an infographic and I was able to just change the wording and picures. The site was easy to navigate around too which was a bonus!
After seeing how simple it was to create an infograhic, I can see how it could be an excellent teaching instrument as well a vital tool for students. I believe it could be a great way to assess their knowledge of a subject that you are teaching. It will also appeal to them because you can use pictures, colours, shapes, fonts and different styled templates.
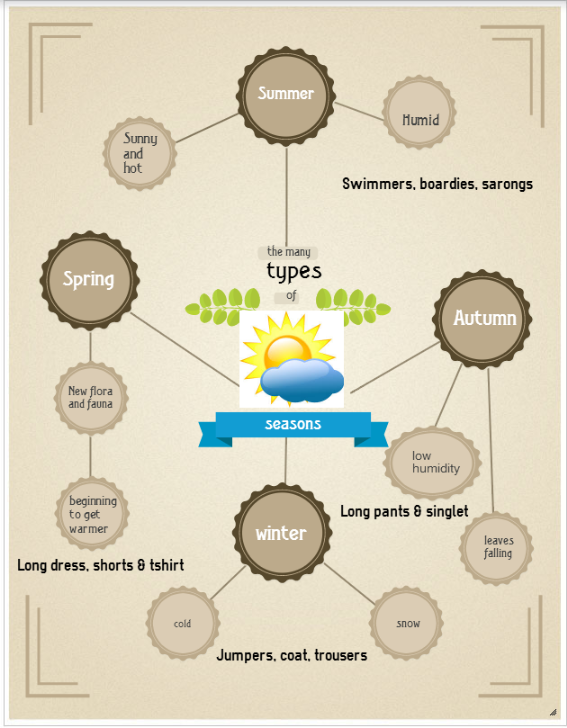
This was the infographic I created:
No comments:
Post a Comment